Newsroom overview

Who They Are
WTF Just Happened Today is a newsletter, blog, and community chronicling the "daily shock and awe in national politics"
Location
Seattle, Washington
Founded
2017
Launched membership
2017
Percentage of revenue from membership
100 percent

When Matt Kiser launched WTF Just Happened Today (WTFJHT) in January 2017, it started as a side project to report on the first 100 days of Trump’s presidency. Early on in the site’s founding, Kiser was spending ~$500 per month (mostly on Mailchimp) to publish the newsletter and run the blog. 

About a month into running the site, Kiser decided to ask his audience for money to help offset out-of-pocket expenses. He knew he needed to raise about $4,000 per month to cover the first 100 days of his work, so he reached out over his email newsletter list to ask for donations. In just a few days, 415 people signed on to support the site. By mid-February, 540 people had signed on and Kiser was up to $3,100 per month in recurring reader support. 

That’s about when he decided to funnel that support into a membership program and quit his day-job to run WTFJHT full-time. That’s also when he realized he needed an actual budget. 

Why this is important

When it comes down to it, the costs and revenues of running a member-driven news site are what determines the longevity of the site. But figuring that out, especially in the beginning, can feel like guesswork. Kiser was only able to commit to WTFJHT once he raised enough money to feel secure enough to quit his day-job. 

Today, he has a more sophisticated sense of what he can expect each month in terms of costs and revenue (and has started to pay for freelancers and other staffing support), but in his early days, Kiser had to make strategic decisions each month based on his revenue projections. 

What they did

Three years after launching WTFJHT, Kiser has accrued a few more monthly costs – including his new, full-time salary, a budget for freelancers, and additional software and tools. Kiser is extremely transparent about the monthly costs associated with running this site. His method for managing his budget remains fairly straightforward. 

In order to be fully transparent with his readers and members, Kiser lists out all of his monthly costs on his website. See below for those costs, ranked from highest to lowest. In total and including other fluctuating costs month to month, this equals a little over $16,000 per month. 

Monthly costs:  

  • Kiser’s full-time salary:  $7,385 
  • Kiser’s risk adjustment for being a full-time contractor: $2,089, or 15% of total cost (quarterly taxes, healthcare, other unexpected costs)
  • Freelancers: $3,000
  • Podcast and Hosting: $2,000 (AWS S3 to host the daily podcast and cache the files with AWS CloudFront; and monthly stipend for podcast producer)
  • Mailchimp Email Service: at least $900 (with a 15% discount applied)
  • Other Tools: ~$320 (a GitHub subscription for hosting the code, YellowBrim for email efficiency, Cloudflare for various security and serving issues, Buffer for posting, Canva for quickly creating social images, and Zapier to automate boring tasks, among others): 
  • Hosting via Amazon S3, and CloudFlare to manage  DNS, SSL certificate, and handle caching: $125
  • NewsWhip Spike, a tool to source daily news (with a discount applied): $100
  • Subscriptions, to the New York Times, Washington Post, Wall Street Journal, Bloomberg, The Atlantic, and a few others: ~$100

WTFJHT is 100 percent supported by members – Kiser doesn’t take any advertising or sponsorship dollars, which is why when he lost 150 net supporters over the past year, it was cause for some alarm. Kiser sees this churn as a part of the natural life cycle of his members, but knew it meant that he would be losing about $900 a month in income. It was time to reach out to his members again and ask for their support. 

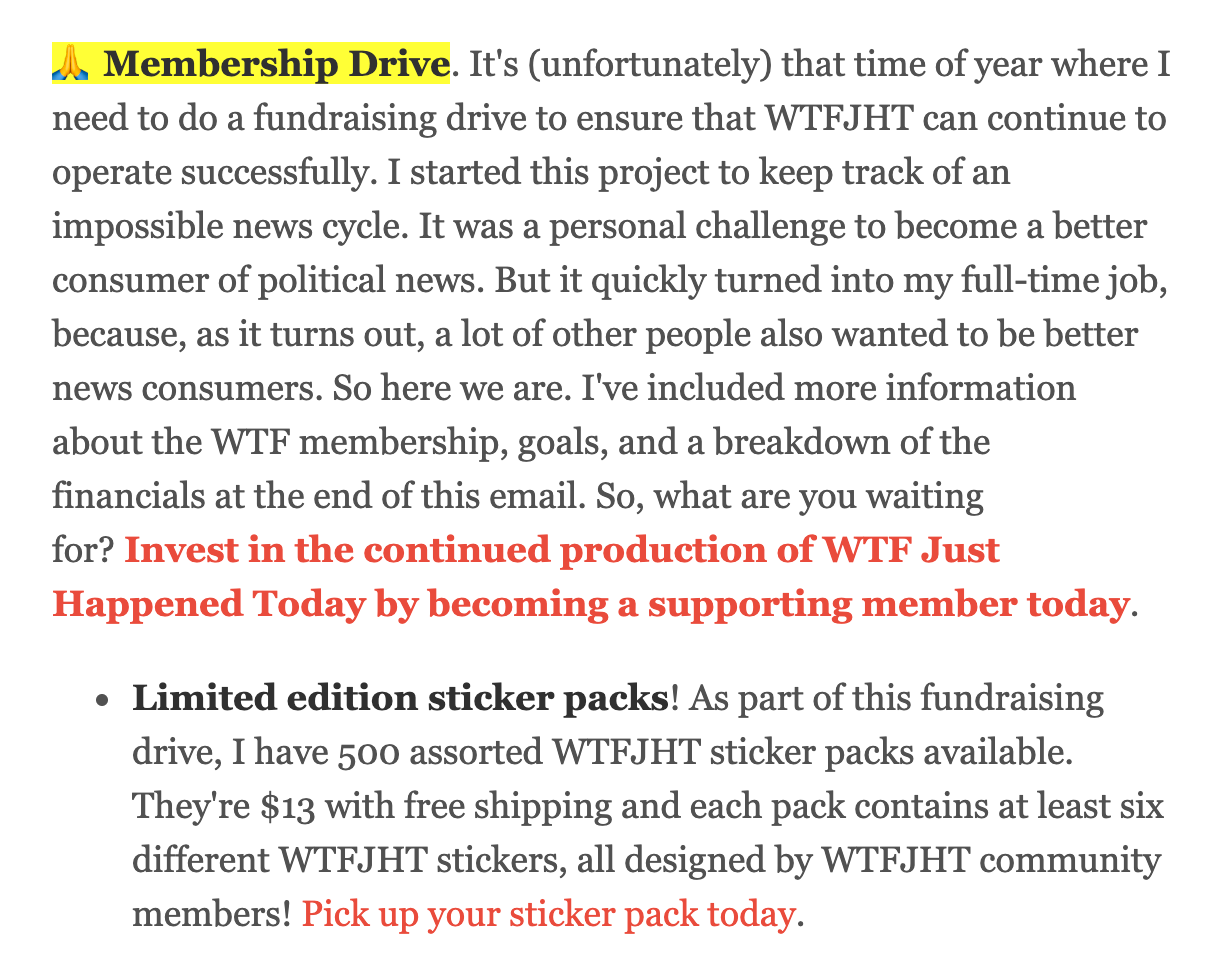
Kiser does not like doing fundraising drives (he feels uncomfortable asking for money). But at the end of the day, this is his full-time job and he knows it needs to be done. So in July 2019, Kiser launched another membership drive with a goal of signing up 200 people to become members. Here’s what he said in the body of an email to readers: 

WTFJHT’s email newsletter appeal (Courtesy of WTFJHT)

The results 

Three days later, after sending only two reminder email to his list, Kiser’s membership drive was about a dozen people away from his goal of 200 new members. 

See below for the update he sent over his email list open to the public: 

WTFJHT’s email newsletter update on the membership drive (Courtesy of WTFJHT)

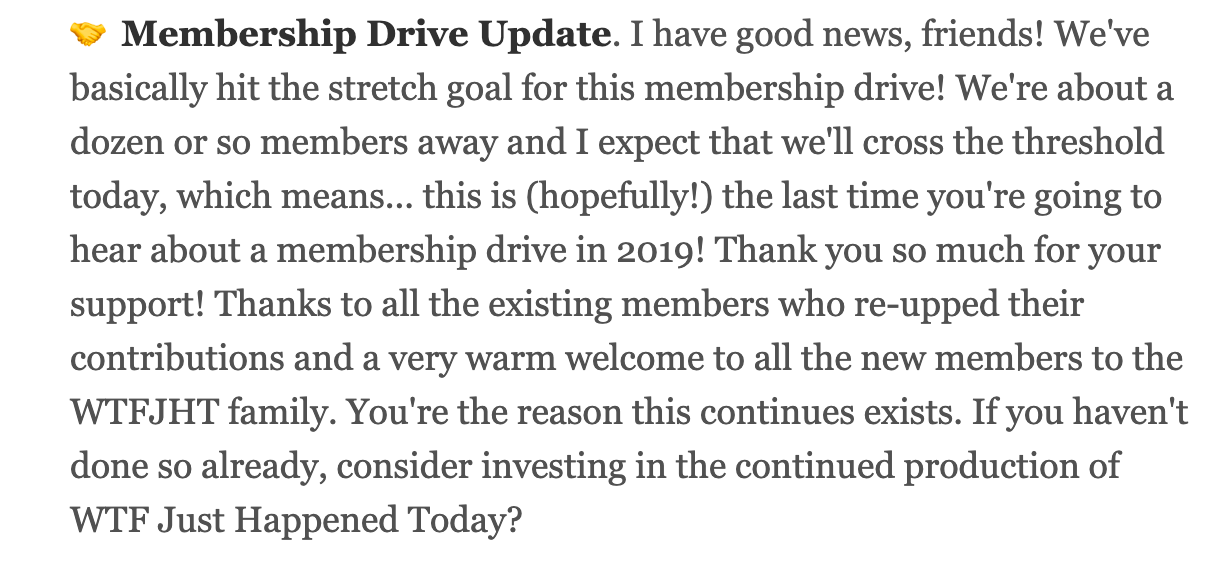
The membership drive brought Kiser back to the financial threshold that enables him to continue publishing without sustainability concerns. 

Over the years and after a few membership drives, Kiser has been able to develop a more sophisticated understanding of incoming revenue from his membership base. This clearer method of projecting revenue took time — after years of collecting data and observing member behavior.

Kiser identified the below three metrics as crucial for developing stronger revenue projections:

  1. Member conversion rate: ~1-2% (a rough percentage of WTF’s audiences — newsletter and website combined — that becomes a member) 
  2. Average monthly contribution per member: $6.17 
  3. Annual Churn Rate: 5.8%

These three numbers help Kiser determine whether he’s on track and what he can afford each month.  Here’s how he explains it: “I’ve outlined my costs and what I want to be earning on the blog. As long as the budget balances, that’s all I care about – It’s how I know I’m creating sufficient value.” 

What they learned

Always set a goal (with a reason behind it) in your fundraising drives, and communicate this to your readers and members. In the past, Kiser made membership campaigns a week long, with no specific goal. At the end, he felt like his audiences were exhausted (and he was exhausted, too, from running his own membership drive over a week where he was still providing coverage each day). Now he always offers an explanation to his readers about why he’s doing a drive (like in the above case, because WTFJHT lost some members), and he sets a clear target. Once Kiser hits the goal, he ends the drive, and starts focusing on how he can retain his new members. 

As a one-person newsroom, don’t get overwhelmed by metrics. Kiser isn’t hyper focused on all of the audience data at his disposal. As he explains: “it’s more important to focus on the basic accounting of income and expenses than any tool or app.” Kiser looks at newsletter and membership conversion rates, average contributions per member, and annual churn rate as his major pieces of “directional evidence” to determine, essentially, is this working or not? At the end of the day, it’s really about making sure revenue exceeds expenses. As long as he can predict when he’s heading for the red and can correct course with member drives, he’s all set. 

Here’s some budgeting advice for other one-person newsrooms: Kiser prefers to use the self-employed version Quickbooks to track his expenses. He likes how Quickbooks has an app and website, connects to his business credit card and bank information, and allows him to easily categorize and create “rules” for expenses that come in. Apart from the DIY version of budgeting, Kiser also uses a CPA once a year to help with his taxes. As a “disregarded entity” (a sole creator with an LLC), Kiser’s unique tax status means he prefers professional help every March to make sure he files taxes correctly. 

Key takeaways and cautionary notes 

Be honest and upfront with your audiences. It helps to share your financial situation with your readers and members, even if it borders on TMI. Kiser finds that being radically honest with his books also helps him alleviate some of his hesitations around asking for money from his readers. As he puts it, “you can see, nobody’s getting rich here!” Being transparent is also one way to build trust when asking people to optionally contribute to your work.

Know when it’s time to pack up. Kiser doesn’t know how long this model will last, and he’s prepared to be able to make a call based on how he sees his member program fluctuate in the months ahead. He’s going to keep tracking the key metrics he uses to forecast incoming revenue and whether or not he needs to ask more folks for financial support, and he knows that he doesn’t know his ceiling. As he puts it:  “I’ve long had a compact with the audience that I’ll keep doing this as long as they keep supporting me. It keeps everyone honest and there will be no doubt come a time when WTFJHT ceases to be relevant, and it’s time to pack it up.” 

Other resources 

Newsroom overview

Who They Are
A local news organization that covers public education in Chicago, Colorado, Detroit, Indiana, New York, Newark, Philadelphia, and Tennessee
Location
Multiple locations in the U.S.
Founded
2014
Membership program launched
2018
Monthly unique visitors
743,000
Number of members
1,100+
Percentage of revenue from membership
1 percent

From the beginning Chalkbeat has had a way for readers to financially support their work, but it was a straightforward donations strategy. They first flagged membership as something to consider in 2014, but didn’t have the capacity to pursue a full membership program at the time. 

In the years following, they continued to grow in readership and revenue, but it wasn’t until 2018 that they had the bandwidth to answer key questions about membership: What would it be at Chalkbeat? Why would they do it? And how significant of an investment would it be to launch and maintain?

Most importantly, they needed to identify the organizational goal for membership: what does success look and feel like, and how could we measure it?

Building on what Chalkbeat knew from years of receiving reader donations, Chief Strategy Officer Alison Go spent two months looking across the organization to develop a framework for determining whether membership was worthwhile and identifying milestones that would tell them if they were on the right track. They launched their membership program in November 2018. 

Why this is important

When assessing whether they’re ready for membership, news organizations spend months choosing their tech stack and designing their membership program. But they often miss a critical step before that: getting specific about what it will look like if membership “works” for them. 

Membership is not a brand campaign that you can toggle on and off when you need a revenue boost or have a bit of extra time. It is both a new relationship with your supporters and a product that you need to manage. Setting off on this path without defining success makes it difficult to assess whether membership is having a positive enough effect on your organization to be worth the significant investment it requires. 

Chalkbeat’s effort to distill its membership experiment into four hypotheses that could be tested and measured within a year of launching a membership program is instructive for news organizations trying to come up with their own definition of success. 

What they did

The first thing the Chalkbeat team established was that membership was not going to be a quick experiment that it could try and fail and then wind down. There would be significant staff, technological, marketing and editorial investment, and the commitments made in the course of a membership program would need to be fulfilled well beyond the end of an end-of-year or spring campaign, said Go.

For two months in 2018, Go was focused full-time on answering a key question: what would it look like for Chalkbeat if membership works? And almost as important, they identified what it would like for membership to not work, and the steps they would take to phase it out. 

“It was not anything technical, it wasn’t like a physical thing or resource, it was the confidence that we would at minimum learn something from this,” Go said.

They identified four hypotheses that they could test by launching membership:

  • Acquisition: Framing small donations as “membership” will drive the highest possible revenue from small donors.
  • Retention: The membership program will have the lowest churn of all small-donor programs.
  • Knowledge community: The membership program will be a critical pillar for a robust editorial knowledge community, ultimately improving the journalism itself and increasing our impact on the community.
  • Costs: The overhead to maintain a membership program will be offset by the benefits. 

They then distilled each hypothesis into a question that data could answer, and identified a “learning time frame” for answering the question, using data from previous donation drives as a baseline. 

  • Acquisition: Does this convert better than our previous campaigns? (1 month)
  • Retention: Do people cancel recurring contributions at a slower rate? If yes, what about the membership program causes this change in behavior? Is it the “membership” framing or specific initiatives within the membership? (3 to 12 months)
  • Knowledge community: Have membership initiatives increased our interaction with our community? Has the quality of our stories improved as a result? Has the reach and impact of our stories increased as a result? (1 year)
  • Costs: What is needed to maintain a membership program and how much does it cost, now and at scale? (1 year)

They decided that if membership did not create incremental revenue but “enabled us to create a feedback loop that we weren’t able to have without it, it was valuable.” 

They also identified revenue milestones that would tell them the role membership would play in the larger financial model. For instance, if membership took 50 percent of an employee’s time to administer and maintain, did it actually pay for itself? And if not at the time, at what size audience would it begin to make sense?

The results

Almost two years after launch, they have more than 1,100 members across the U.S., have generated insights into their four hypotheses, and added one more after launch. This bolstered the case for hiring a dedicated person to support membership. 

Acquisition: They did not see a significant spike in member/donor acquisition in the first two months. Membership grew at about the same rates as their newsletters did.

Retention: Member/donor retention started in the high 90th percentile, and it has remained high since. 

Knowledge community: They have found that it’s easier to engage with members than it was to engage with donors because of the ongoing communication with them, but they are struggling to build local knowledge communities because the membership program is run centrally, at the national level. Kary Perez, who runs their membership program today, says: “As our national team grows, we can continue testing what a national-level knowledge community might look like.” 

Costs: “Our [newsletter] subscriber to member conversion numbers are average. Even at average, we know we can do better. The membership program conclusively pays for itself – the ROI isn’t super high, but it pays for itself. …Even at the launch of the membership program, it was clear it was worth the investment,” Perez wrote in an email. Their launch year, they brought in $53,000 from members, not quite hitting their $60,000 goal – but the following year they brought in $80,000, exceeding their new $55,000 goal.

Synergies with other initiatives: Chalkbeat uses the end-of-year membership campaign to bolster major donor giving and vice versa, such as having a major donor offer a match to motivate readers to become members. Plus, the development team can reuse membership assets and content in their outreach to major donors. 

After their successful launch and end-of-year campaign in 2018, they knew they should invest in a grander version of individual donations, and that they needed a more dedicated resource to do that. In 2019 they hired Perez as the senior marketing manager to manage the membership program.

What they learned

Membership has proven to have both revenue and engagement impact for Chalkbeat. That’s why Perez, the organizational point person for membership, sits between the revenue and editorial teams. They’re still trying to understand which is the primary role it plays, she says. The $80,000 membership brought in for 2019-20 is substantial, but that was only 1 percent of their budget due to their foundation and major donor support. For this reason, it might end up being more critical as a mechanism for greater engagement.

Having membership raises questions about inclusivity. Member benefits are inherently exclusive, and Chalkbeat is asking itself whether it’s possible to square special experiences for members with their organizational commitment to equity and inclusion. “The whole point of our model is that everyone should have access to our work. The questions we ask ourselves are: How does any nonprofit have a membership program? How are we meant to be accessible for everyone while also offering member benefits? How can we create a truly inclusive membership program?” Perez says. 

So far, they have decided that they won’t limit access to anything that’s useful for creating educational outcomes, and they’re exploring how they might create pathways to membership that don’t require a monetary exchange. 

Key takeaways and cautionary tales

A membership program needs measurable goals. Setting off on a path to membership without defining success makes it difficult to assess whether membership is having a positive enough effect on your organization to be worth the significant investment it requires. As Go noted, membership isn’t a quick experiment that can be wound down if it doesn’t “work.” Chalkbeat’s effort to distill its membership experiment into four hypotheses that could be tested and measured within a year of launching a membership program is instructive for news organizations trying to come up with their own definition of success.

Other resources

Newsroom overview

Who They Are
A nonprofit, nonpartisan news organization, providing Michigan readers with daily, fact-driven journalism covering the state's issues, including diverse people, politics, and economics
Location
Ann Arbor, Detroit, and Lansing, Michigan
Founded
2011
Launched membership
2019
Monthly unique visitors
About 1,000,000*
Number of members
7,414
Percentage of revenue from membership
11 percent

In just two years, Michigan’s Bridge Michigan increased reader donations by 66%, increased the number of monthly donors by 54%, and grew its email list by 114% by enacting strategies. 

Bridge did this by running a series of targeted experiments at each level of the audience funnel. It set clear goals and targets for how it would define success at each level, and then enacted strategies around SEO, email newsletter growth, and more to meet those goals.

The test-and-learn mindset allowed Bridge Michigan to experiment with new content formats by expanding its email newsletters and making its coverage more search friendly, which drew in new regular audiences and attracted new members.

*Pre-coronavirus pandemic, Bridge Michigan averaged around 300,000 monthly unique page visitors.

Why this is important

Bridge Michigan’s strategies weren’t revolutionary. They were simple and straightforward. By focusing on bite-size tests focused on audience growth through SEO and audience habituation through email newsletters, Bridge was able to turn small, individual successes into a larger strategic win through increased revenue and increased membership.

Newsrooms looking to implement test-and-learn strategies for membership should start by focusing on small experiments. 

“You don’t need every unique visitor to give you money, but you need to find ways to get people to do that at each level,” Bridge Michigan’s growth strategist Bill Emkow said during a presentation at ONA19 in partnership with the Facebook Journalism Project. Bridge was a participant in the 2019 Facebook Membership Accelerator. (The Lenfest Institute partners with Facebook to administer the program and share best practices from its participants.) 

What they did

Bridge entered the Facebook Journalism Project’s Accelerator Program with some financial support from readers, but no formal strategy for growing its membership program.

The first thing Bridge Michigan had to do was define its audience funnel. Broadly, a funnel stars with occasional users and filters down to regular users and ultimately contributors.

Here’s how Bridge defined its funnel based on its reader habits and audience analytics: 

Underpinning every stage of the funnel is regular publication of high-quality coverage. Bridge publishes about 3-5 news stories per weekday. Here’s a breakdown of Bridge’s strategy at each level: 

Unique visitors to repeat visitors

At this stage, Bridge focused on SEO-friendly headlines that could get their stories in front of new audiences. 

“The most effective way to build the unique visitor base is by having more stories and more posts on the topics the audience cares about,” Emkow said. 

The next step is getting unique visitors to come back at least five times a month. 

Bridge pays close attention to its audience analytics, and if it recognizes that a particular topic is attracting a consistent audience, it will double down on that coverage. Emkow uses Google Search Console to identify which search terms are leading people to Bridge. He sends a weekly memo to the staff with the specific terms readers are using to reach the site via search.

In 2018, Michigan voters legalized recreational marijuana. Bridge noticed that the topic began trending on Google and attracting social media attention the next year, as the law was about to go into effect. 

So Bridge increased its coverage and then optimized past coverage for SEO as well. The site assigned one of its politics reporters to dive into marijuana. 

FJP’s David Grant explained how they did it:

Following SEO best practices, they linked every new marijuana story to old marijuana stories and wrote keyword-rich page titles and headlines. In the article below, notice how (circled in red) there’s a list of previously published stories before you start reading the article itself. The story’s first sentence includes the term “marijuana in Michigan.” The entire story is optimized for SEO.

However, a handful of their stories didn’t generate much readership, so the team assumed the topic was dead. 

Though Emkow argues that they ultimately pulled coverage too soon. 

“I argue that we just had three stories that didn’t connect,” he said over email. “We should’ve kept chipping away, IMHO. I think that lessons we learned from marijuana were applied during coronavirus. We just keep hammering away, and we’ve been rewarded by readers.”

Growing its email list

Email is a powerful tool for developing habit with readers, a prerequisite for converting them to members. 

“It’s letting you into their lives more,” Emkow said. “Once they let you in, you can have a conversation with them.” 

Bridge has a daily newsletter, and it encourages readers to sign up with non-intrusive sliders that pop-up after the reader has spent a few seconds on the page. It has also added a week-in-review newsletter and RSS-automated health and environment newsletters that are sent automatically the day after the site publishes a story on that topic. 

Bridge tweaks the language on the email calls-to-action depending on the source of where the reader is coming from, or the news of the moment. It previously targeted CTAs to a reader who clicked on a link via Facebook with an email sign up encouraging them to become less reliant on the social giant’s algorithms while someone who came by typing bridgemi.com into their browser will get a more general CTA.

The lefthand image is a message for a reader who arrived at Bridge after typing it into their browser. On the right is a visitor who arrived via Facebook.

Tools such as OptInMonster, which Bridge Michigan uses to power its lead generation, offer A/B testing capabilities, so you can test out different calls to action to see which is most effective based on. 

Bridge has also used Facebook lead generation ads to grow its email list. 

Conversion oriented

Your owned-and-operated platforms, such as your website, are the most important place to ask for donations. Bridge made the donation button more prominent and added a stronger call-to-action. 

The original “Donate” button

The more prominent “Donate” button Bridge uses today

It also added pop-ups to news stories and modules at the bottom of articles that encourage support. By seeing how users respond to these different call-outs, Bridge has been able to grow its donations. 

Most Bridge readers only read one story, so Bridge has three different CTAs per story to encourage membership. 

“Yes, be mission oriented, but to create sustainability be conversion oriented,” Emkow told me in an email. “To paraphrase Eminem, if you have only one shot to turn a casual reader into a paying member, what do you do?”

Sustaining members

Bridge realized that its donations page was not set up to encourage recurring contributions even though its ultimate goal was  to encourage one-time donors to contribute on a recurring basis and provide stable, predictable revenue. So they defaulted their donation pages to a monthly ask.

It also raised their default membership option. Bridge wanted to set its default membership option to $10/month, but Tim Griggs, its accelerator coach, encouraged the site to set it at $15/month. In his post, Grant explained how behavioral economics informed that decision: people are most likely to choose the default price, followed by the cheapest option. 

Griggs suggested Bridge Michigan make their default $15 per month, $10 as a second option, and any amount as a third. “It worked,” Emkow says. “We saw an immediate increase in overall monthly donations, but specifically $10 and $15 per month.”

Setting defaults is essential — you need to tell your audience what you want from them. 

“A blank field leads to confusion,” Emkow said via email. ‘How much should I give? How much do they want? What’s a lot, what’s too little?’ Eliminate confusion. The $15/month suggestion was basic behavior economics: people tend to choose the default, but the second most popular option is the second-highest price option.”

Bridge has also started re-sending fundraising emails to readers who didn’t open them. It started as a small experiment: Two days after sending a fundraising email it sent it again, and it made nearly the same amount as the first email. 

A quick note: Though many news organizations, including Bridge Michigan, use donations and membership interchangeably, we consider them two distinct engagement and revenue models with different relationships between supporters and the newsrooms

The results

Bridge has seen growth at every stage of the audience funnel. 

In 2019, toward the top of the funnel, these strategies grew its overall unique users by 35 percent to 2.4 million and its email subscribers skyrocketed by 59 percent to 13,374. 

The site generated nearly $300,000 from 3,600 members — a 45 percent increase in revenue and 54 percent increase in total members. The growth has continued in 2020. As of early September, it has 7,414 members who have contributed $436,724.

Emkow also recently launched a Facebook lead gen campaign to attract new email addresses. The ad targeted users who were similar to Bridge’s most loyal email subscribers and who resided in Michigan, the site’s target audience. It used an image from its COVID-19 tracker, and removed the words and numbers because Facebook dings images that are text heavy.

In the first two days, the ad netted Bridge 331 new email addresses with a $0.29 CPA. Over three weeks, he was able to add 2,180 new email subscribers at a cost of $.64 per email. 

Emkow initially spent $606, but raised the budget to $3,000. “I don’t want to lose the opportunity at this cost,” he said. 

What they learned

Keep track of costs. Facebook can be a valuable lead-generation tool — but the juice has to be worth the squeeze. Emkow said he’ll boost posts or use Facebook’s email lead generation tool, and then meticulously watch costs to make sure that they are staying below targeted CPAs. 

You don’t need to be an analytics expert.: Emkow is the first to admit that he’s not an expert at Google Analytics. While there are many sophisticated analytics tools, Emkow was able to glean insights by look at each level of the funnel individually and then seeing how they correlated. For example, he’d look first at overall traffic levels and then at the number of email newsletter subscribers. If he saw growth in both categories, then it would be safe to assume that readers were moving down the audience engagement funnel. 

“I’m just looking at correlations. If you’re seeing big growth in one spot and not correlating growth in other spots, there’s something you need to check out,” Emkow said. 

Pick your spots. Most membership-driven newsrooms, including Bridge, have limited resources. The site uses a combination of editorial judgment and its analytics insights to make decisions about what to test and which areas to focus on that will move its audience down the funnel. Newsrooms should 

“Be the authority on certain topics that matter to both your audience and your editorial judgment,” Emkow said. 

• Put user experience first. You don’t want to overwhelm your audience, and you should be careful about how intrusive your CTAs are. Let the data be your guide. For example, Bridge noticed that its conversion rate on on-site email pop-ups didn’t change when it changed its frequency from every one day to every three days. So users saw the pop-ups less, and Bridge still was able to grow its email list. 

Key takeaways and cautionary notes

Focus on each step of the funnel. By breaking its strategy down by steps in the funnel, Bridge was able to run concentrated experiments that focused on growing its overall audience and increasing its email list, which ultimately moved the needle on Bridge’s overall goal — growing its membership base. 

By keeping its experiments small and manageable, Bridge was able to make incremental progress that ultimately resulted in significant growth. 

Let the data guide you: It’s important to be data literate and understand what your audience analytics are telling you, but membership-driven publications need to have strong values and editorial judgement. Don’t let the data lead you to pursue audiences and stories that aren’t in line with the core membership value proposition. 

Other resources

Newsroom overview

Who They Are
A Dutch member-driven news organization that brings context to the news by rejecting the daily news cycle and collaborating with their readers.
Newsroom
De Correspondent
Location
Amsterdam, The Netherlands
Founded
2013
Launched membership
2013
Monthly unique visitors
550,000
Number of members
68,944
Percentage of revenue from membership
53.8 percent*

The Dutch news organization De Correspondent made a commitment from the beginning to collect as little data on their audience members as they could. In addition to an internally built CMS called Respondens, De Correspondent uses the “Google Analytics alternative” Matomo

Data analyst Daan Aerts explained that information from Matomo cannot be traced back to an individual person, but that anonymized aggregated information includes details like pageviews and homepage visits, country-level location, and sign-up page actions. Location information doesn’t get more specific than city-level, and the company uses a visitor’s full IP address to determine his or her location before stripping off the last digits and storing the address. There’s no tracking of visitors across their devices.

Member-specific information can be used to internally understand information including how much on-platform conversation an individual article has generated, new member reach, and average member financial contributions. Aerts adds, “I benefit from a well-designed data governance plan. In my work, I never come across identifiable information about our members. Within our organization, people have access to data on a need-to-know basis.”

In the U.S. the investigative news organization The Markup similarly limits its collection of reader data, partially informed by De Correspondent’s approach.

*95 percent of De Correspondent’s revenue came from readers in 2019. The remainder came from book sales and donations.

Why this is important

Nearly every online interaction we have – shopping, reading, socializing – is tracked. At a time when this has become standard across the industry, many individuals are concerned about their digital privacy and footprints. As detailed in one of the more human, readable examples of an organizational privacy policy, De Correspondent limits what it collects both on principle and in practice. 

As their sister English language news organization The Correspondent details in their member compact, privacy and audience revenue don’t have to exist in tension with each other. And the organizations stands out in being forthright in their intentions in this regard, telling readers, which helps build trust.

Courtesy of The Correspondent

What they did

Most De Correspondent members are located in the European Union or the European Economic Area, and are protected under the General Data Protection Regulation (GDPR). But it isn’t the only reason that De Correspondent has committed to collecting minimal data.

Over seven years of publishing, De Correspondent has seen that its current and prospective members don’t just say they care about how their privacy is treated on site – they truly want to know the organization’s policies with regards to their own information. As shown below, the company provides more details on the handling of user data than many of its peers. 

These practices are also detailed in the privacy and cookie statement on The Correspondent and shared here in English. (Note that under US law, where many members of The Correspondent reside, unfair or deceptive uses of data are unlawful. Beyond that, federal privacy laws vary by the type of data or marketing used and also vary by industry. The Correspondent’s policies are voluntarily and comparatively conservative in terms of what data the company collects, as detailed below.)

More information regarding the handling of member information is as follows from the public privacy and cookie statement. Note the sentence “we also use all of this data to gain insight [in]to the reading preferences of our members (in legal terms, because we have a legitimate interest to do so)”:

The results

While it may be harder to “know” members without having much data about them, De Correspondent has been able to get the information it needs to design smart editorial products and cultivate loyalty through voluntary audience research.

Part of that comes down to their decision to invest more in editorial and membership staff. For most of its existence De Correspondent has not employed full-time data analysts. Aerts became the organization’s first data analyst in 2019 and works on the three-person membership team alongside a strategist and membership director. (Conversation and engagement editors work in parallel from within the editorial department.)

Aerts has spent the past 18 months building dashboards and synthesizing membership data, as well as creating self-service tools for the organization, including a “Daily pulse” Slack channel  – an automated Slackbot that provides organizational clarity into how membership is growing or stagnating compared to goals.

De Correspondent cofounder and CEO Ernst Pfauth said that with this work the organization is still following its principles and anonymizing user data, but presenting it better internally for cross-team intel. Pfauth said that the days are past when, “If I wanted to know something about churn, for example, I had to ask a developer [and] a developer made a query and then they showed it to me. And now by building these dashboards [we’re] making the data more accessible to everyone.”

Relevant information is also distributed in a weekly member email and monthly presentations to all staff.

What they learned

Prioritizing privacy does not mean you will be data poor. Mayke Blok, Aerts’ teammate and membership strategist at De Correspondent and The Correspondent, told MPP: “We believe that you can often get sufficient information without collecting huge amounts of data from your members. There’s always a way to work around not having all the metrics available. You can use surveys, or ask the questions you have in a different way.” For more information on De Correspondent’s surveying practices with members, jump to MPP’s case study on how De Correspondent collects qualitative insights about its members.

Blok said that the membership team is regularly coming up with questions about its members, such as how important the first 30 days of a membership are to their willingness to keep supporting the publication, and considers those insights along quantitative data.

“To answer that question we looked at cohort data, but also implemented a survey that provided us with a lot of context. You need to contextualize the numbers you do have, instead of falling into the rabbit hole and just keep trying to find out more by collecting more and more data,” Blok said.

It’s not just about not collecting as little data as possible, it’s about making sure it’s used only for the right purposes. Protecting users’ privacy is also about making the right choices with the data you do have access to. Aerts offers an example: Technically, De Correspondent could tell who is very interested in journalism about LGBTQ issues and use that a number of ways. But De Correspondent opts to use that data only to show someone their “recently read” stories.

Key takeaways and cautionary notes

It’s possible to maintain user privacy while collecting meaningful data for product decision-making. De Correspondent collects data including time on site, bounce rate, visits per visitor (according to cookies), e-commerce sales, and events like clicks on menu items and comments, all of which they track anonymously. Compared to other digital news organizations, this is a low amount of information – something its members value greatly.

Other resources 

Disclosure: De Correspondent was a founding partner of Membership Puzzle Project.

Newsroom overview

Who They Are
A national, born-digital publication focused on policy analysis and investigative journalism that has branched out into lifestyle, sports, and business coverage
Location
South Africa
Founded
2009
Launched membership
2018
Monthly unique visitors
3,500,000
Number of members
13,693
Percentage of revenue from membership
25 percent

After two years of marketing Maverick Insider, the Daily Maverick’s membership program, Publisher Styli Charalambous and Maverick Insider General Manager Director Francesca Beighton mapped out, audited, and set objectives for the marketing strategy going forward. 

They also invested time in understanding and applying the behavioral biases that underpin consumer behavior, which has helped them understand what motivation they’re trying to appeal to whenever they write a membership appeal. These are the results of that exercise.

Why this is important

Categorizing, measuring, and routinizing their marketing strategy helped Daily Maverick streamline its marketing efforts, which helped to reduce the amount of time and decision-making required to execute. This gave them more time to devote to cause-driven work that makes membership more appealing, and also made it easier to adapt to the coronavirus pandemic.

This strategy document also helps keep Maverick Insider marketing mission-aligned. When targets are ambitious, it can be tempting to try anything to hit them, including exaggerating, making promises you can’t keep, and tailoring your message to increasingly niche audiences, warns Beighton. Having a North Star document gives staff members something concrete to hew to. It also helps when onboarding new team members.

What they did

The Daily Maverick records the conversion rates of every piece of marketing outreach at the weekly Maverick Insider meeting.  Using that data, they took a holistic look at what worked and what didn’t, then took a look at their goals for Maverick Insider and built the roadmap from there. 

The strategic overview includes the following:

  • A definition and mission statement for Maverick Insiders
  • An articulation of Maverick Insiders’ values, including how that presents in the tone used 
  • Objectives and key results for 2020, both quantitative and qualitative, plus an articulation of what part of the Daily Maverick team is responsible for each objective and key result
  • Characteristics of potential members and the size of their target market
  • A marketing plan for converting readers into members, broken down by channel (direct mailers, banners, post-article footers, etc.)
  • A marketing plan to raise general awareness of Maverick Insider and reinforcing value for existing members, broken down by channel (an onboarding series, press coverage, net promoter score surveys)

After establishing the baseline with all of the above, Beighton turned to the core phases of growth hacking to develop a plan for 2020 and beyond. Different marketing initiatives can be at different stages at any point in time. 

  • Test: Create a MVP. In other words, test a campaign to see if it resonates with our readers. 
  • Track: We need to track – and report – on what is and is not working using a combination of analytics and member feedback. 
  • Alter: From our reports, we should be able to pivot quickly and fix what is not working. 
  • Improve: We should be constantly striving to improve our marketing using innovation and our technical capabilities. 
  • Scale:  We don’t do things by halves in Maverick Insider. When it’s working, ramp it up and maximise our returns. 

Here is a detailed overview of the Daily Maverick’s Maverick Insider marketing strategy, including their actual targets for each channel.

The results

Using the strategic plan, Beighton set member conversion targets for each channel. The Maverick Insiders team will be spending the rest of 2020 testing different channels and messages to determine the right mix for reaching their average monthly member growth target of 1,000 people.

Marketing ElementNumber of ActionsTarget sign ups per actionTarget Total
Direct Mailers2150300
Banners41040
Post-article footers525125
Newsletter footers41560
Social Media21020
Editorials17575
Webinars81080
Piano targeted messaging2100200
Referrals1100100
Total1000

With the basics mapped out, they can now get more sophisticated with their test/track/alter/improve/scale framework. 

They recently started categorizing their marketing messages based on the behavioral biases that each appeals to. Those biases, articulated in detail by social media platform Buffer, are: 

  • The bandwagon effect: The tendency for someone to do, say, believe something if a high number of other people have already done so.
  • The zero risk bias: The tendency to favor paths that seem to have no risks. (This is why companies offer money-back guarantees, for example.) 
  • In-group favoritism: The tendency to prioritize products and ideas that are popular with a group they’ve aligned themselves with.
  • Confirmation bias: The tendency to favor and recall information that confirms or amplifies beliefs that they already have.
  • Endowment effect: The tendency to assign more value to things merely because they already own them. 
  • Not invented here: Not Invented Here is the aversion to use products or accept ideas that are developed outside of a group. If you as a customer don’t recognize, identify with, or understand a product or service you’re less likely to use it. To counter this, newer companies often align themselves with better-known brands. 

Another not mentioned in the Buffer overview that the Daily Maverick appeals to often is the “IKEA effect” – the tendency to value more highly things that you’ve already invested effort in. 

The Maverick Insiders team uses these biases to design A/B tests and systematize their marketing efforts. The biases offer a formula for good writing and can be used as a “checkbox exercise” to make sure there’s a strategy behind the appeal. Beighton often asks herself, “What bias am I writing to?”

It’s no longer “today we’re going to ask aggressively,” Beighton says. It’s “how are we going to nudge people toward certain behaviors?” 
See here an example of a recent direct mailer, which Beighton says was designed to appeal to the bandwagon effect (by highlighting the 12,000 members Daily Maverick already has), and to test the efficacy of reverse psychology (“You probably won’t be interested in this, but…”). See here another example of the bandwagon effect, published early on in the coronavirus pandemic.

What they learned

A systematized marketing strategy has uses beyond membership. Maverick Insiders is one of several components of the Daily Maverick’s work that needs to be marketed. They also have a books division, a robust events strategy, a suite of newsletters, and a budding podcast division. Going through this process for Maverick Insiders “makes it surprisingly manageable to keep track of [marketing for] all the different divisions,” Beighton told us. 

Categorizing, tracking, and analyzing has allowed them to build routines, design templates, and craft a realistic roadmap that they can stick to. It’s become a simple, formulaic process to determine the right channel and message for marketing something new, whether that’s a newsletter, podcast, or event. 

Putting the values down in writing proved critical as the Daily Maverick experienced a major staff growth spurt. They’ve added a lot of new staff recently who are still learning the value proposition and how to apply it to marketing efforts. “It’s so easy when you’re marketing anything to cross the line. It’s so easy to tell a white lie. The minute you start doing that, everything falls apart,” Beighton warns. “It keeps you honest, which is essential.”

Beighton said it also helps that Publisher Styli Charalambous is in the weekly marketing meeting and both he and Editor-in-Chief Branko Brkic are in the weekly Maverick Insider meeting, which helps keep the messaging aligned. “The busier we become, the faster we work, the easier and more likely we are to have an error in judgement. These meetings reconnect us with the cause each week,” Beighton said.

Key takeaways and cautionary notes

You don’t need deep analytic expertise to measure your marketing efforts’ impact. Simply categorizing each appeal by the type of message it conveys and tracking the conversion of each will give you valuable insights about what resonates most with your audience, reducing the guesswork with each membership appeal.

Keep your value proposition front and center. Without a common, well-articulated understanding of the mission and values of the thing that you’re marketing, using these structures can become overly formulaic to the point of lacking resonance. Getting the value proposition right is just as important as categorization, routinization, and test-and-learn process.

Other resources 

Disclosure: Membership Puzzle Project has provided support to the Daily Maverick’s membership program through the Membership in News Fund.

Developing membership metrics

Every member-driven newsroom should have a membership strategy that provides the basic outlines of what you will do and how you will do it. You implement your membership strategy through your membership program and memberful routines. Membership objectives help you answer the question of whether you are fulfilling your membership value proposition. You measure progress on your objectives with metrics and markers. 

The goal of this section is to help you set objectives in line with your membership strategy, and measure your progress toward those objectives with both metrics and markers. In other words, it will help you assess how effectively you are delivering value to your members.

When we say “metrics,” we mean the indicators that can be quantified into clear-cut numbers and percentages, such as what percentage of your email newsletter list you are converting into paying members. 

When we say “markers,” we mean qualitative indicators that can’t necessarily be quantified, but that are valuable indicators that you should keep track of, such as the diversity of people who attend your member events, or the quality of comments you receive from member emails. 

What gets measured in a news organization is what gets done, the trope goes. That’s why it’s critical that your metrics and markers connect to your membership strategy, and that you pay as much attention to measuring your progress on developing memberful routines as you do on growing your membership program.

This is easier said than done. We live in an era of unprecedented data. The temptation when setting up a metrics regime is to assume that if something can be measured, it must be important. But just because something is measurable, doesn’t mean it’s more important than something that is hard to measure. Complicating things further, news organizations are just beginning to figure out how to measure and track progress on memberful routines.

Parsing the signal from the noise should be your primary aim in choosing what metrics and markers your newsroom will pay attention to as you develop your membership strategy.  

The goal of this section is to help you identify, set up, and track metrics and markers that promote the vitality of your membership program and memberful routines. MPP will walk you through the three core components of developing an actionable, measurable membership assessment strategy, and offer insight into how other member-driven newsrooms are doing the same.

This section will cover: 

How to assess your effectiveness at creating value for your members. Your membership value proposition is the North Star for your membership strategy. The research team will explain how to translate the components of your membership value proposition into objectives, and identify the right metrics and markers to measure your progress. Assessing your effectiveness at creating value also involves tracking your retention of members.

How to assess your effectiveness at cultivating and converting loyal readers into members. This includes tracking the growth of your loyal audience and the conversion of your loyal audience into members. 

How to assess your effectiveness at balancing the costs and benefits of delivering the program. This includes assessing the monetary and as well as non-monetary contributions of members, and understanding your business model for membership.

Contextualizing your membership program. MPP has created a survey that will benchmark the goals and key performance indicators of member-driven newsrooms across the globe. So far we have collected data from 40 newsrooms. In the final parts of this section, we will present the early results from the survey that illustrate the range of membership efforts in newsrooms across the globe. Use these results to inform your own objectives, metrics, and markers.

How do we define and measure membership success?

The MPP research team has worked with many member-driven newsrooms that struggle with the same question: what does success in membership look like? Success in a member-driven newsroom looks like creating value for your audience members so that they become members, and creating value for your members so that they stay. 

Although membership value looks different from newsroom to newsroom, the same process of assessing value can be used in any newsroom. To define specifically what your membership program’s success looks like involves setting clear, measurable objectives for your membership program and your memberful routines. (Objectives are specific outcomes and measurable steps that bring you closer to your goals, which are usually broader and more aspirational.)

Some measures of success, such as the number of members you have or a reduction in your churn rate, are quite straightforward, and the research team offers advice on sustainability metrics below. (Jump to “How do we assess how well we are balancing costs and revenue?”) But others, particularly those connected to memberful routines, can be a little harder to identify and measure. Those begin with going back to your membership value proposition to identify what success means for you. 

This section will focus on how to set objectives based on your membership value proposition, and how to use those objectives to assess how effectively you are creating value for your members.

Start with your membership value proposition. If you used the process in the handbook section “Discovering our value proposition,” it might look something like this.

“Our [membership program] helps [our loyal supporters] who want to [user jobs to be done] by [membership feature] and by [membership feature].” 

For example:

“Our membership program helps our loyal supporters who want to contribute to important issues in their community by connecting them with our reporters.”

At this stage, you’ll add a new component to this statement: your desired outcome:

“Our membership program helps our loyal supporters who want to contribute to important issues in their community by connecting them with our reporters to generate local story ideas.”

To understand what constitutes success, you now need to turn your membership program value proposition into a question. At the program level, you may have a more general value proposition question:

Is our membership program helping our loyal supporters who want to [user jobs to be done] by [membership program feature] and thereby [membership program outcome]?

Is our membership program helping our loyal supporters who want to contribute to important issues in their community by connecting them with our reporters to generate local story ideas?

To set detailed objectives for your membership program, turn each part of your membership value proposition into a question that you can answer. Break your membership value proposition down as much as you can. 

  • Is our program reaching the people who want to contribute to the important issues in our community?
  • Is our membership program connecting our members with our reporters effectively?
  • Are our reporters incorporating members’ story ideas into their work?
  • Do our members who generate story ideas feel they are contributing to important issues in their community?

Decide on the indicators you need to answer your questions. What indicators do you need, and how will you measure those in order to answer your value proposition questions?

To illustrate this, using the sample value proposition questions above, here is how you might translate your questions into indicators and measurement strategies.

Example: Turning questions into indicators
Value Proposition Question: Is our membership program reaching the people who want to contribute to the important issues in our community?

Indicator needed: A measure of who our membership appeals are reaching.

How to measure it: Newsletter open rate is a good estimate of how many loyal readers are getting our membership appeal.

Indicator needed: A measure of how many loyal readers want to contribute to important issues in their community.

How to measure it: We can run a periodic survey of our newsletter list which asks whether subscribers value contributing to important issues in their community. The number of respondents divided by our total newsletter subscribers would give us an estimate of the percent of our loyal readers who could potentially benefit from this part of our program.
Value Proposition Question: Is our membership program connecting our members with our reporters?

Indicator needed: A measure of members who connect with our reporters.

How to measure it: We can ask our reporters to log the members they interact with for story ideas in our CRM.
Value Proposition Question: Are our reporters incorporating members’ story ideas into their work?

Indicator needed: A measure of the stories that come from reporter/member connections.

How to measure it: We can ask our editors to flag in our CMS when a story that originated or involved a member’s idea is published.
Value Proposition Question: Do our members who generate story ideas feel they are contributing to important issues in their community?

Indicator needed: A measure of whether members who generate story ideas feel they are contributing to important issues in their communities.

How to measure it: We can ask reporters who interact with members on a story to send a quick follow-up survey asking whether the process satisfied their desire to contribute to important issues in their community. Or, we can ask our reporters to ask the member directly and jot some notes on each interaction.

Articulate your objectives using your indicators. Now you have a list of indicators of success and a plan for how to measure each. Next, you will articulate objectives. A good objective will have a timeframe and specified metrics or markers.

Going through this process of setting objectives should help you: 

  • Answer the question “what does success look like”
  • Establish a set of metrics and markers to track
  • Establish a set of measurement practices to put in place

You can use your own historical performance in combination with industry benchmarks to determine a range of metrics or markers that would be reasonable. But industry benchmarks and historical performance can only take you so far — you need to know how to set reasonable objectives for your own newsroom and learn how to adapt them through testing and iteration.

Based on the example above, here is what a series of measurable objectives might look like.

Example: Articulating objectives using indicators
Is our program reaching the people who want to contribute to the important issues in our community?

Objective: In one year, we will convert 25 percent of our newsletter subscribers into members. 

Metric: 25 percent of 4,000 subscribers = 1,000 members.
Is our membership program connecting our members with our reporters effectively?

Objective: In one year, we will connect 100 members with reporters to discuss story ideas.

Metric: 100 members connected with reporters.
Are our reporters incorporating members’ story ideas into their work?

Objective: In one year, we will produce 50 member/reporter stories.

Metric: 50 member/reporter stories.
Do our members who generate story ideas feel they are contributing to important issues in their community?

Objective: Over the course one year, 75 percent of the members who generate story ideas will report they feel they are contributing to their community.

Metric: 75 percent of members report feeling they have contributed.

Pull it all together into a statement of what success looks like. For the example above, this looks like beginning with the value proposition:

Our membership program helps our loyal supporters who want to contribute to important issues in their community by connecting them with our reporters to generate local story ideas.

And then adding what constitutes success:

Our objective in the first year is to convert 1,000 members from our newsletter list and connect 100 of those members with our reporters to co-produce 50 stories. Our objective is that 75 percent of those members who contribute stories will tell us after the experience that they feel they have contributed to their community.

Chalkbeat in the U.S. went through a similar process when they decided to launch their membership program in 2018, setting acquisition, retention, engagement, and revenue objectives. 


How Chalkbeat defined and measured membership success

They started with four hypotheses about what implementing membership could do for Chalkbeat.

Assessing your effectiveness at creating value also involves tracking the retention of your members. If your value creation starts to wane, you will see it in your retention metrics. Jump to “Retaining our members” for help setting retention-specific objectives. 

You can use the process above, which helps you turn a membership value proposition into a series of measurable objectives, to clarify and track the intended impact for any area of activity. To get a sense for what the outcomes of this process can look like when applied to an overall mission, see this example of how City Bureau aligned its mission, its intended outcomes, and the metrics it tracks.

How do we assess how well we’re converting audience members?

Loyalty is the most important precondition for membership, and your ability to cultivate loyal audience members and convert them into members is the foundation of a strong membership program. It is also the most important factor shaping whether you will be able to keep the members you have. To cultivate and retain members, you need to orient your organization around measuring loyalty, more so than reach. (Jump to “Growing our membership” for tactics for growing your membership program.) 

The key user behavior to track in order to assess your effectiveness at cultivating loyal readers is repeat action. If repeat actions in your general audience are lacking, that is a red flag that you will struggle to convert audience members into members. To assess the loyalty of your audience by repeat action, the research team recommends that you focus on the following metrics. This advice is written primarily for text-based digital news organizations, but if that doesn’t describe your organization, you can substitute a measure of loyalty in your primary channel for most of this guidance. 

Regular use of your site (or primary channel). Instead of measuring the spikes in web traffic month after month, the research team recommends focusing on the size of your web audiences that keep coming back to your website – a good metric is users with 3+ or  6+ sessions per month. (German membership platform Steady has identified 3+ sessions per month; U.S. public media’s research across newsrooms in its industry recommends using 3+ through 6+ sessions to set a more robust bar for loyalty.) For additional reading on loyalty metrics, MPP recommends:

  • Digital Content Next and the Lenfest Institute for Journalism’s case study of Slate’s membership program, which found that Slate readers who read eight articles or more a month were far more likely to join. 
  • Brian Boyer’s Memberkit 1.0, which walks newsrooms through why measuring regularity on web matters and how to pull the right numbers. Here’s the spreadsheet Boyer uses when crunching the numbers, and here’s the writeup about how he did it. 

Regular use of your email newsletter products. For most member-driven digital newsrooms, email is the most reliable channel for cultivating loyal audience members and converting them into members. An increasing number of digital publications publish exclusively through newsletters, or focus on that as their primary channel with their readers. 

That’s why the research team recommends tracking the percentage of your newsletter audience that is loyal, which the research team has identified as opening your email 75 percent of the time. (If you use Mailchimp as your email service provider, that is the subset of your newsletter list that is a 5-star reader.) For more on newsletter metrics, see NewsletterGuide.org.

Regular use of other newsroom products. The Membership Puzzle team knows site visits and email aren’t everything, particularly in countries where WhatsApp is the more dominant means of communication. When measuring the success of your other products that create loyalty and lead to membership, focus on regularity – or the number of people who keep coming back to use your product again and again. For this purpose, MPP defines a product as anything your newsroom produces that connects people to your journalism. Podcast-based news organizations might look at episode downloads and the average percentage of an episode that listeners complete. 

What tracking loyalty metrics can do for you. Tracking and analyzing loyalty metrics can help newsrooms build more audience-centric and member-centric products. For example, Krautreporter analyzed their members’ habits and found that, across all of their platforms and products, their members most regularly interacted with email newsletters and article pages the most. As a result, Krautreporter developed a newsletter strategy with several topic-focused newsletters, each written by a reporter. See Krautreporter’s Engaged Journalism Playbook for more

As an example of how newsrooms can use loyalty metrics to bring newsrooms closer to membership, KPCC in Southern California created “loyal and local” dashboards for their reporters to track loyalty metrics on the stories they produce. The dashboard reports on the number of loyal users per story (or people who have three or more web sessions in a 30-day period) and compares it to the median number of loyal users for their stories. This way, reporters don’t just see  “500 loyal users” – but instead, they see “500 users is 20 percent above or below your median for the last six weeks.”

KPCC’s Executive Editor Megan Garvey and Audience Insights and Development Manager Patrick Dougall have worked with KPCC reporters on how to incorporate the dashboard into their workflow. Garvey encourages reporters to focus on this loyalty metric, above all, when assessing the performance of stories. 

As Dougall explained: “We’ve tried to educate the newsroom that we’re not as focused on getting a huge amount of traffic for your individual stories. It’s really about – how many people do you inspire loyalty with? And then we’re working to use a lot of that [audience member] loyalty to a specific reporter to deliver more targeted membership asks.”

You don’t have to track loyalty in a dashboard. For an example of a newsroom that measures loyalty without a custom dashboard, public media station KQED in San Francisco measures both total reach and “loyalty” across each audience platform. For example, after hosting an event, the team measures the number of attendees overall and the number of repeat event attendees. See earlier MPP research, “Loyalty is membership’s North Star. Here’s how news sites & advocacy groups measure it,” for more.

The key metric to track to determine your effectiveness at converting loyal audience members is, unsurprisingly, conversion rate. Conversion rate is the percentage of audience members who join as members, divided over the sum total of your audience members over some specified period of time.

Conversion rates can vary by medium, by message, by user type, and by time. If you want to boost your effectiveness at converting members, it helps to understand conversion behavior in these categories. For a simple template for tracking that, see MPP coach Federica Cherubini’s process for tracking member acquisition.

Conversion rates by medium: These metrics can include percent of newsletter subscribers who convert to membership, percent of web users who convert to membership, and percent of event attendees who convert to membership. For most publications with membership, newsletters are the most effective conversion medium and it is worth tracking conversion per newsletter product. But members can convert in other places as well – at the end of an article page, on your homepage, or at an event. You have to be able to set up a source tracking system that links your web analytics system to your CRM to be able to track conversion at different places on your site. This can be complicated, but it is worth tracking your conversion rates by medium to understand where you’re most likely to make an effective ask. 

What these metrics can do for you: Tracking conversion rates by medium can help you understand how and where to focus your membership appeals. For example, if you find newsletters to be your most successful method for converting members, your newsroom could instead focus calls-to-action in its other platforms (events, article pages) around asking your audiences to sign up for your newsletter, thereby initiating the newsletter audience funnel. 

Conversion rates by message: These kinds of metrics include conversion rate by campaign theme, conversion rate by appeal author, and conversion rate by marketing message.

What these metrics can do for you: Tracking conversion rates by variables like campaign theme, appeal author, and marketing language can help you learn about what membership messages resonate most with which parts of your audience. Your audience is not a monolith, and they have different motivations for supporting your work, which means you need to ask audience members to become members in a variety of ways. If you are experimenting (e.g. A/B testing) with membership messages, you should be tracking conversion rates by message. The results of these experiments can help you learn about your audience and fine-tune your membership marketing strategy. Jump to “Growing our membership” for more on marketing strategies.

Conversion rates by time: These kinds of metrics include calendar-based metrics like annual conversion rate, but also seasonal conversion rates like end-of-year.

What these metrics can do for you: Certain times of the year (for example, end-of-year campaigns) can be more effective for membership conversions than others. By tracking conversion rates by time and over time, you can note where your conversion rates line up with strategic initiatives like a new member drive, or external events like major breaking news. 

Conversion rates by user behavior: More mature newsrooms that have audience segmentation capabilities can also track conversion rates by audience segment. These types of metrics assign a conversion rate to regular patterns of audience behavior detected by an audience intelligence system.

What these metrics can do for you: Tracking conversion rates by user behavior can tell you if certain types of stories or beats tend to drive conversion to membership, or if certain story layouts or calls-to-action convert some users better than others. If you don’t have an integrated CRM and CMS, you can proxy conversion-by-user-behavior by creating specialized email newsletters that focus by topic, beat, or theme and compare conversion rates across those different products.

The Daily Maverick has recently started tracking member conversion based on the method of persuasion a membership appeal employs. Here’s how they’re doing that.


How Daily Maverick developed a membership marketing roadmap

It begins with recording the conversion rates of every piece of marketing outreach at the weekly Maverick Insider meeting.

The beauty of tracking loyalty and conversion metrics together is that they can be combined and compared to understand the member journeys that users take from casual reader to member. With those kinds of insights, you can boost membership conversion.

For an excellent example of a metric that pulls a few of the above mentioned elements together to boost conversion, Brian Boyer writes that a major indicator his team at Spirited Media (formerly Billy Penn, Denverite, and The Incline) tracked was the percent of readers who converted to donors in their first 30 days after subscribing to the newsletter. By tracking this metric, the Spirited team learned that the longer they waited to ask a newsletter subscriber for a financial contribution, the less likely the subscriber was to click the button to donate. (If you use Mailchimp for your newsletter, see Boyer’s report on how to get this metric up and running.) 

An audience funnel is the most common way newsrooms track loyalty and conversion rates together. See MPP’s case study on Bridge Michigan for an example of how a member-driven newsroom developed a test-and-learn strategy along the audience funnel to fuel membership growth. Bridge was able to run concentrated experiments that focused on growing its overall audience and increasing its email list, which ultimately moved the needle on Bridge’s overall goal — growing its membership base. 


How Bridge Michigan tested its way to membership growth

They designed a set of targeted experiments at every stage of the audience funnel.

What to do when you don’t have access to most of these metrics: Most of the newsrooms that the research team was able to study are digital organizations that publish on their websites and/or via email newsletters and distribute their content via newsletters and social media. They have ample data to work with. But newsrooms publishing on platforms that provide little access to data have to find other ways to understand conversion. Surveys can offer a slice of the necessary information.

The Continent, the weekly pan-African newspaper, is published as a PDF and distributed on WhatsApp, which also provides very little data. So once a year they send their readers a survey with fairly granular questions about how they first heard about The Continent, whether they share it with others, how they share it with others when they do, how they read the PDF, and what parts of the weekly magazine they enjoy the most. Co-founder Sipho Kings said that they get a few thousand responses from their subscriber base of more than 100,000 phone numbers and that they’re likely to send more frequent surveys in the future.

A note on tracking number of members. Of course, the simplest and most general measure of your effectiveness at converting members is the number of members in your program. But this can be an imperfect indicator of success. Audience growth will often also drive member growth. If you are growing your audience or making changes to your membership program, you should be paying close attention to your conversion rate to assess the impact of your changes rather than just the number of members.

Plus, strong incentives like special merchandise or discounts can drive spikes in membership that may boost your membership in the short term, but they may prove to be fickle once the incentive wears off. 

Whatever loyalty and conversion measures you track, do so carefully and intentionally. Due to privacy laws or the missions of the newsroom’s themselves, some member-driven newsrooms opt to prioritize audience privacy, above all. To illustrate how newsrooms can still make data-driven audience decisions while collecting minimal data on their audience members, MPP interviewed De Correspondent in The Netherlands. 

De Correspondent uses the “Google Analytics alternative” Matomo, a platform that only collects information that cannot be traced back to an individual person. Instead, it tracks anonymized aggregated information like page views and homepage visits, country-level location, and sign-up page actions. In the U.S., the investigative news organization The Markup similarly limits its collection of reader data, partially informed by De Correspondent’s approach. 


How De Correspondent keeps its commitment to collecting minimal data

They invest heavily in collecting qualitative insights volunteered by members instead of funneling up quantitative data.

How do we assess how well we are balancing costs and revenue?

Another cornerstone of your membership strategy is becoming sustainable: assessing the costs of running your membership program against the benefits it generates for your organization. You should choose metrics that reflect both the monetary and non-monetary value of members’ contributions. This section provides some guidelines for choosing sustainability metrics. Jump to “Making the business case for membership” for detailed advice on how to develop a business plan for your membership program. 

To assess the financial sustainability of membership, you should build on the components of your business model to create a set of metrics you can measure and assess monthly, quarterly, and annually. 

Tracking revenue: To track the revenue generated by your membership program, you should at a minimum pay attention to high-level membership revenue metrics such as total membership dollars (monthly and annually); your percent of total revenue from membership; and your growth rate of membership revenue (monthly and annually). 

Examples of objectives tied to membership revenue could include: grow annual membership revenue by 5 percent and increase total share of membership revenue from 5 percent to 10 percent of total revenue.

In addition to paying attention to the overall number of dollars generated by your membership program, you can also analyze revenue generation by other variables. These can help you understand where your membership dollars are coming from and where you excel at generating membership revenue so you can create strategies that boost it further. Consider tracking membership revenue in the following categories:

  • Segmented membership revenue metrics: These types of metrics include average contribution per member, number of members who opt for each tier (if you have membership tiers), and revenue generation by tier.
    These metrics can help you: Finetune your contribution levels and understand which categories of membership are generating the most revenue for you. You can collapse, expand, or combine membership tiers as you assess the performance of member-based revenue over time. A very important type of member-related revenue metric is Customer Lifetime Value. See below for more advice on using this metric.
    (Jump to “Designing our membership program” for more advice on pricing and tiers.)
  • Time-related revenue metrics: These kinds of metrics include monthly membership revenue, quarterly membership revenue, and annual membership revenue.
    These metrics can help you: Assess your revenue performance against revenue goals on a monthly, quarterly, and annual basis.
  • Conversion-related revenue metrics: These kinds of metrics include membership revenue per source (e.g. calls-to-action on the newsletter or site), membership revenue per campaign, and membership revenue per call-to-action.
    These metrics can help you: Assess which membership marketing and conversion
    channels are your most effective revenue drivers. 

An example of an objective supported by revenue metrics might be: Grow our average contribution per member from $5/month to $10/month by changing the defaults on our pricing page.

Tracking Costs: Jump to “Making the business case for membership” for detailed advice on how to think about costs categories for membership. MPP recommends tracking ongoing costs in two broad categories:

  • Staffing, technical, and overhead costs: These costs include membership staff costs (salary and benefits), technology license and maintenance costs, and any portion of staff time in software development, newsroom, or engagement that are devoted to membership work.
  • Direct programmatic costs: These costs are the direct costs of running a membership program and include expenses like member event management, merchandise, and fulfillment.

You can use these categories of costs to construct the following types of metrics:

  • Member program related cost metrics: These types of metrics include cost per category of member and cost per benefit delivered.
    These metrics can help you: Assess how expensive your program’s benefits are relative to categories of membership (if you have tiered benefits) and relative to types of benefits. Breaking down costs by member and benefit type can also help you decide when a particular benefit is becoming too expensive to deliver relative to the number of members who take advantage of it, or when a particular membership tier is too costly to maintain and should be trimmed.
  • Time-related cost metrics: These types of metrics include monthly membership costs, quarterly membership costs, and annual membership costs.
    These metrics can help you: Assess your expenditures to support membership against your budgeted amounts on a monthly, quarterly, and annual basis.
  • Conversion-related cost metrics: These types of metrics include marketing dollars spent per member converted per source and marketing dollars spent per member converted per campaign. These kinds of costs are typically considered under the label “cost per acquisition” because they show you on a unit basis, how much you are spending to convert one member.
    These kinds of cost metrics can help you: Assess which membership marketing and conversion channels are most expensive and where you are spending your budget relative to where you are gaining members. 

MPP turned to Matt Kiser, who founded WTF Just Happened Today and remains the sole full-time staff member, for an example of how to develop a simple metrics regime to track costs and benefits of his membership program.

In summary, Kiser tracks conversion rate, average contributions per member, and churn rate as his major pieces of “directional evidence” to determine, essentially, is this working or not? At the end of the day, it’s really about making sure revenue exceeds expenses. As long as he can predict when he’s heading for the red and can correct course with member drives, he’s all set. 


How 1-person, member-driven newsroom WTFJHT built its budget

He pays attention to just three metrics for setting revenue projects: member conversion, average contribution, and churn.

Calculating return on investment: The final step in assessing sustainability is actually comparing revenue and cost to understand the financial return on investment of your membership program. At a high level, you can use your business model to subtract your (monthly or yearly) revenue from your (monthly or yearly) costs to get a dollar figure for the net revenue (or net cost) generated by your membership program. You can express that number as return rate by dividing your member dollars generated by the total cost of your program. 

You can use the same process to understand the return on investment of particular member benefits and the return on investment of marketing membership in different conversion channels. 

An example of an objective based on a return on investment might be: Generate $100,000 in net revenue from membership over the next two years by decreasing the average program cost per member and increasing our members’ average monthly contribution.

What these metrics can do for you. If you don’t have a membership program, a prospective return on investment calculation can help you decide if membership is right for you (jump to “Making the business case for membership” for more). If you have a membership program, a return on investment calculation can help you understand if the investments you’ve made in membership are paying off (if revenue is one of your objectives). Even if financial return isn’t an objective of your membership program, a return on investment calculation can be helpful to understand if you’re comfortable with the ratio of membership costs and returns.

Calculating customer lifetime value. The sustainability goal of retention is to cultivate long-term relationships with members. A member’s support becomes more and more valuable over time as their cumulative contributions add up. But how can you track this accumulation of value? Customer Lifetime Value is a metric that comes from subscription management and is one way to capture the monetary value of members over time.

Here’s a simple way to calculate CLV:

You can calculate the average revenue per member by dividing total monthly membership revenue by total members over a 6 or 12-month period, depending on how you’re projecting. 

The easiest way to calculate the average lifetime of a membership is through a simple calculation, which will tell you the average number of months a membership will last: 1 ÷ Monthly Churn Rate

What this metric can do for you. CLV calculations bring together member revenue and member loyalty into a single metric. Writing for the Lenfest Institute, reader revenue specialist Matt Skibinski said that CLV is a valuable metric for publishers to track because it helps publishers see beyond basic traffic metrics as a way to measure success: 

“If newsrooms could view successful coverage not just as content that generates clicks, but also as journalism that delivers value to subscribers, it stands to reason that they would respond to those cues in the decisions they make day-to-day.”

How do we factor member participation into cost and benefit calculations?

One of the hallmarks of a member-driven news organization is that audience members and paying members are able – and encouraged – to participate regularly in non-monetary ways. This is a practice MPP calls memberful routines. Such participation can be difficult to track and quantify.

However, because evidence from outside news suggests that participation deepens members’ loyalty and retention, MPP believes it is well worth the effort of trying to measure a member’s participation journey. As researcher JP Gomes told MPP, “It’s possible that participation measured in hours, rather than dollars, correlates with how connected people feel to an organization.” 

To do this, MPP recommends measuring repeat participation by audience members and paying members. You can start by paying attention to how many audience members accept your opportunities to participate, whether that’s something small like filling out a survey or a multi-hour commitment, such as helping with fact checking. MPP recommends constructing your own “participation ladder” to help you track participation, as many organizations beyond news do. Jump to “Developing memberful routines” for more on that.

But you can also take a different approach to tracking participation and attempt to value non-monetary contributions directly. How can you do this? In 2019, MPP researcher Joe Amditis explored how organizations outside news are assigning actual financial value to non-monetary contributions. The strategies below – based on his research for MPP – can help you understand the depth of a member’s relationship with your organization and help you identify potential advocates and amplifiers. 

Create value estimations for yourself and your members. While a qualitative member contribution might be difficult to put a direct dollar figure on, that doesn’t mean you can’t estimate. What does a particular member contribution save in staff time, for example? Or what might you pay a freelancer or contractor for a similar contribution? The Water Environment Research Foundation created a benefit cost tool to “help people decide how to objectively evaluate the intangible benefits of a particular project or initiative,” which allows it to translate qualitative benefits into monetary value.

Devise a point system for contributions. If you don’t want to go as far as estimating a dollar value, you can also devise a separate point system that can help you track the relative and cumulative value of member contributions over time. You could even allow members (or non-members) to exchange those points for member benefits. For example, Google’s Local Guides program allows users to earn perks — such as badges, early access to Google products, or even free cloud storage — by contributing photos, videos, or other information to Google Maps. Different types of contributions are assigned point values, and the more you contribute, the more you earn.

Exchange membership for high-effort contributions. You can also exchange membership for particularly important and effortful member contributions. This puts a dollar value directly on the efforts of contributions because you know the price (and cost) of a membership. If you want to try this strategy, consider the time, resources, and know-how that would constitute a membership-worthy contribution, and offer avenues for participation along those lines. Maldita in Spain considers audience members who have volunteered their expertise to help them fact check misinformation to be members, alongside those who offer Maldita recurring financial support.


How Maldita enlists members’ ‘superpowers’ to fact check

Maldita weeds out trolls trying to wreck their fact checking by asking respondents to upload proof of their credentials.